Sequenced-based data on GBIF - What you need to know before analyzing data
As I mentioned in my previous post, a lot more sequence-based data has been made available on GBIF this past year. MGnify alone, published 295 datasets for a total of 13,285,109 occurrences. Even though most of these occurrences are Bacteria or Chromista, more than a million of them are animals and more than 300,000 are plants. So chances are, that even if you are not interested in bacteria, you might encounter sequence-based data on GBIF.
So why I am writing about this? The fact is that sequence-based data have different implications in terms of data quality but they are not necessarily obvious. In this post, I will try to summarize what you need to know before downloading and analyzing sequence-based data available on GBIF.
Just a disclaimer: I am not a specialist and this blog post is highly simplified. Don’t hesitate to complete this post by adding your own comments.
Type of sequence-based data on GBIF
As mentioned in my previous post, the term molecular-based data refers to any type of data associated to some genetic material (DNA or RNA sequence, genotype, etc.).
These data can be sorted in one of the two following categories:
- the genetic material comes from an observable specimen (whether it is macro or microscopic),
- the genetic material is the only evidence of a given organism or community, see for example metagenomics samples.
In the first case, we know that the organism was present at a given date and location. Therefore, it would be reasonable to treat these occurrences as any other observation. However, in the second case, you need to take into account a few parameters before deciding whether or not you should include a given occurrence in your analysis. Thankfully, this is what the rest of this post is about ;)
Unfortunately, there isn’t any easy way to filter the GBIF occurrences based on genetic material only. The Basis of record might be a clue but you cannot always rely on it, as it depends on the type of organism concerned.
- If the genetic material was sampled from a macro organism, the
Basis of recordfor such occurrence will most likely bePreserved specimenorHuman observation. - However, if the sample was taken from a colony of bacteria or a fungus (or anything growing in a petri dish really), the
Basis of recordmight beMaterial sample, which is the same basis of records as the occurrence belonging to the second case I mentioned.
Note that, a macro organism can also be detected in a metagenomics sample so you cannot just exclude all the macro-organisms with a Material sample basis of record.
I tried to illustrate the two types of sequence-based data available on GBIF. See the two figures below.
The genetic material comes from observable (microscopic) organisms

The genetic material is the only evidence of a given organism or community

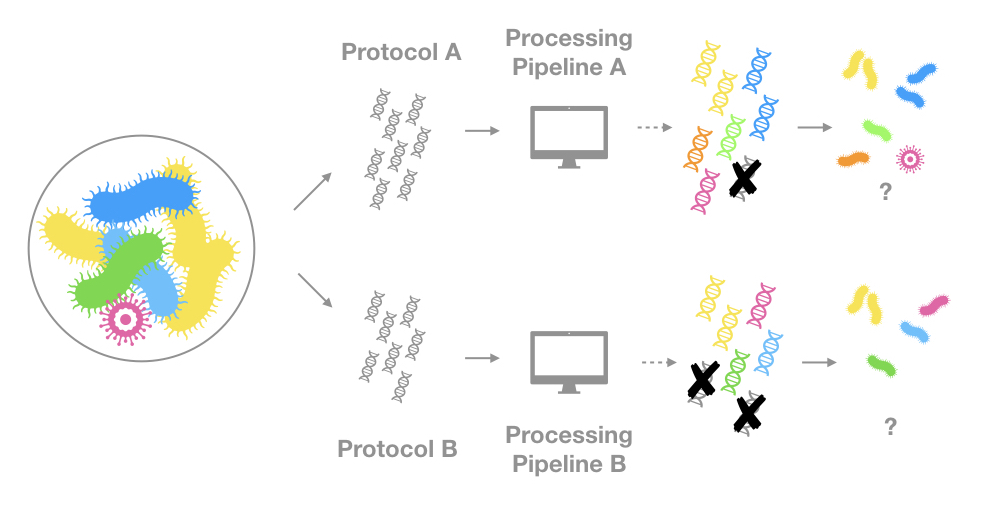
Sequencing protocols and processing pipelines affect significantly what is detected
This might not surprise anyone but the same sample sequenced with different technologies and processed with different bio-informatics pipelines can give very different results. Even just changing a parameter in one of the the steps of the quality control can change which organisms you will detect. This is why you must take into account the protocols and pipelines used when analyzing this type of occurrence, especially if you are pooling together data from different sources.
Here is another simplified illustration of the problem:

I cannot explain the subtleties of sequencing technologies nor can I list all the different program used to process reads, these are entire fields on their own. I trust that the data providers to know what they are doing. And if you download occurrences from the same data source, you will probably have a homogeneous and reliable basis for your analysis. However, I will attempt to give a very high level overview of what is happening before you access these “genetic” occurrences on GBIF.
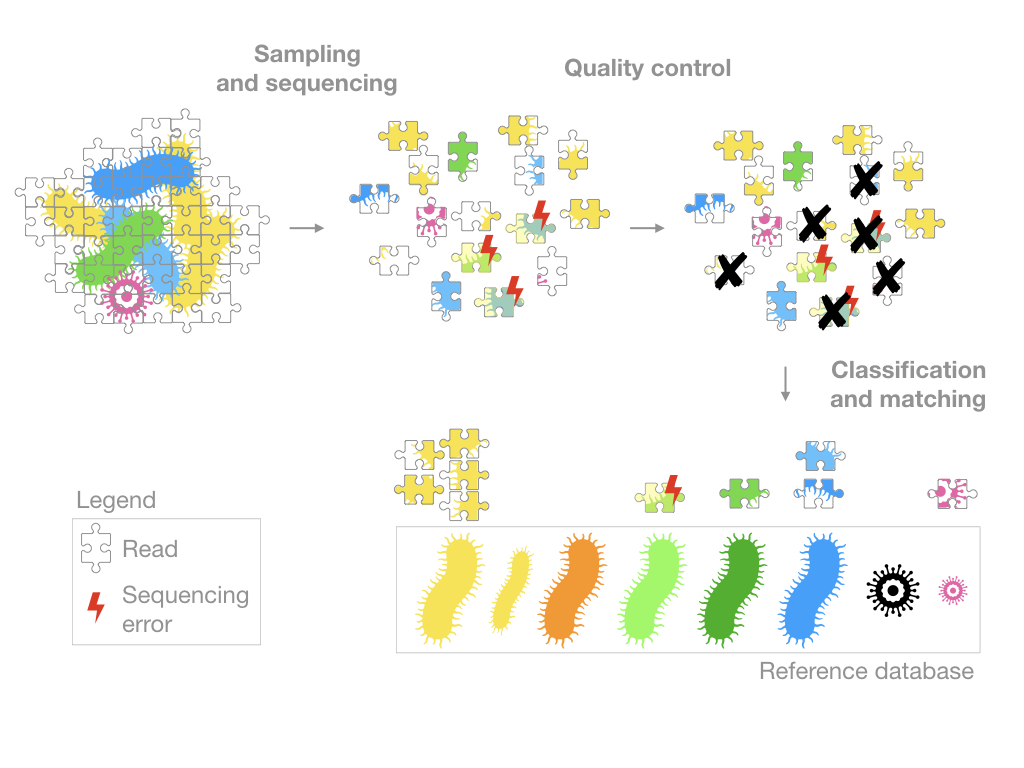
In order to explain this, I will use the metaphor of a jigsaw puzzle.

Sampling and sequencing
The samples are prepared and sequenced. A growingly popular approach is shotgun sequencing, you might also encounter the term high-throughput technology or NGS technology which is a catch-all term for an array of methods applying to genome sequencing, genome resequencing, transcriptome profiling (RNA-Seq), DNA-protein interactions (ChIP-sequencing), and epigenome characterization.
When comparing data from different sources, it might be a good idea to check which technology was used and was its indented purpose: which organisms are targeted? Prokaryotes, eukaryotes, both? Which genomics regions are targeted? Is everything sequenced or only the 16s? What is the error rate for this technology? What is the length of the sequences generated? etc.
In any case, most of these methods will generate reads that are essentially short DNA sequences (represented in my figure by puzzle pieces). The goal will then be to figure out where these reads come from.
Quality control
The quality control section of a pipeline depends on the sequencing technology used so it is difficult to generalize. However, the goal is always the same, to remove the low quality sequences.
Very often, it will include the following steps:
- “trim” the reads (remove artifacts generated by the sequencing technology)
- remove the short reads
- remove the “low quality” reads
- (assemble the reads in longer sequences)
Keep in mind that all sequencing technologies generate errors (essentially typos in the genetic code) and although the quality control strives to make the data as clean as possible, some of these errors can persist.
Classification and Matching
The reads are often grouped into Operational taxonomic unit (OTU) and/or matched to a reference database.
Depending on the programs and the reference database used, you will get very different results. This might be obvious but if my reference database contains only prokayotes, I won’t be able to identify anything else. Some reads from eukaryotes might even match to some organisms in my database, thereby creating false positives. Of course, these programs generate matching scores and setting a stringent threshold can reduce the amount of false positives but some still persist.
Note that the number of reads matched to a given species cannot be directly interpreted as the abundance of that particular species in the sample. Yes if you have more of genetic material available, you will get more reads but this relationship is not linear.
You should also pay attention to the total number of clean reads generated. 10 reads matching bacteria A out of 100 is not the same as 10 out of 10,000 (check the last paragraph to know where to find this information).
It makes sense to have a cut off based on the percentage or number of reads matching a given taxon. Sequencing errors are unlikely to occur systematically on the same sequences, which means that one read can be affected but not many. So if a high percentage of reads matchs the same taxon, this occurrence is more likely a true positive. Or the other way around, if only one read matches a taxon you should be more careful when interpreting the data.
You should also pay attention to read length. Longer reads are “larger” pieces of the puzzles, programs can assign them to taxa with higher confidence levels.
Essentially, what I am saying is that the number and length of the reads matter.
7 points to check in case of doubt

If you are not sure whether a given occurrence is a true positive, I suggest that you check the following points. Even if everything seems to check out, you should consider the occurrence like any other (with the appropriate level of skepticism).
- Is the
Basis of record,Material sample? - Is the occurrence associated with: an observation, a specimen, an in vitro culture or an environmental sample?
- Which sequencing technology was used?
- What is the reads length?
- How stringent was the quality control?
- What was the reference database used?
- How many reads match your taxon of interest and how many reads were in the sample?
Where to find the information necessary to answers these questions?
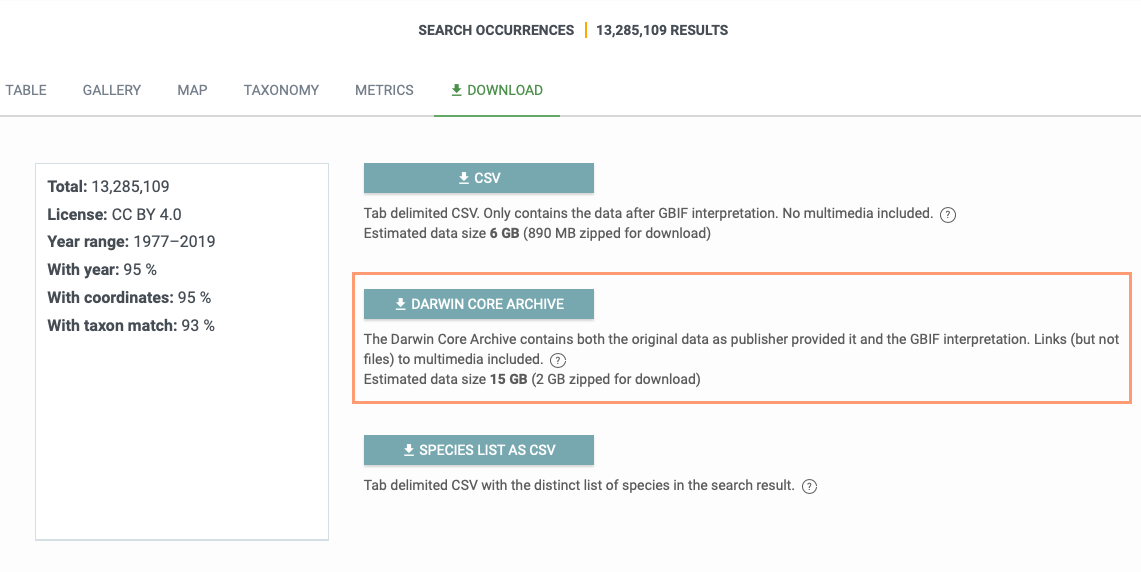
The location of this type of information might vary depending on the data provider. I suggest that you check the method description in the dataset’s metadata and the raw Darwin Core Archives (see the screenshot below).

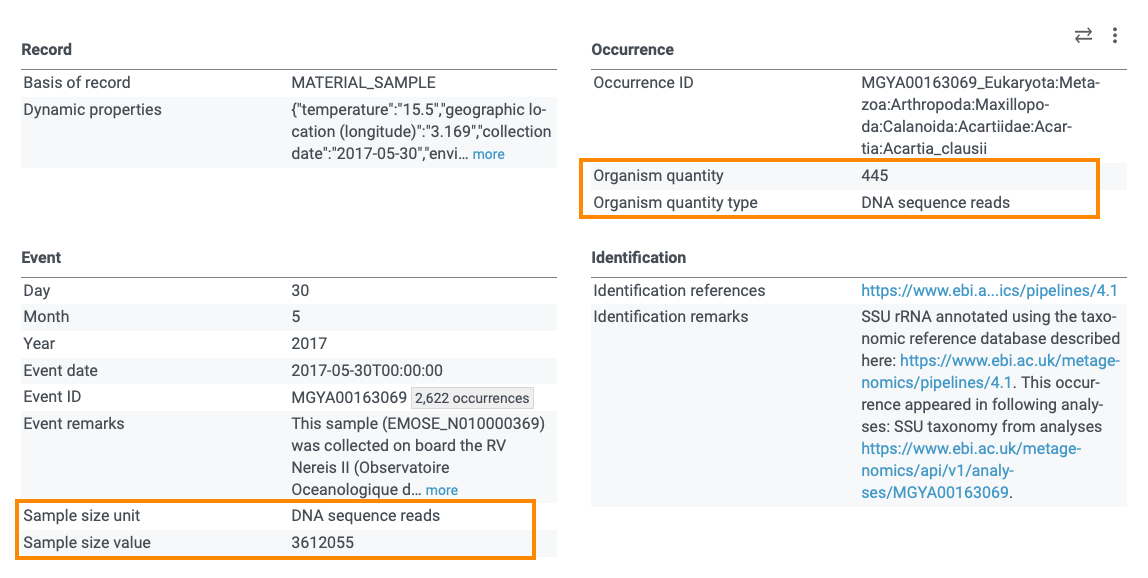
The information might be available in some extensions or mapped to the Darwin Core terms. For example, in Mgnify datasets, the total number of reads in a sample are given in the event file under dwc:sampleSizeValue and dwc:sampleSizeUnit and the number of reads matched to a specific taxon are given in the occurrence file under dwc:organismQuantity and dwc:organismQuantityType. See for example, this occurrence:

You can check my previous post about sequence-based data publishing for more information.
Please let me know if this post is useful and don’t hesitate to add any comment if you notice anything missing.
