Hunger mapping
Where are we missing biodiversity data?
A hunger map is a map of missing biodiversity data (a biodiversity data gap). The main challenge with hunger mapping is proving that a species does not exist but should exist in a region. Hunger maps are important because they could be used to prioritize funding and digitization efforts. Currently, GBIF has no way of telling what species are missing from where. In this blog post I review some potential ways GBIF could make global biodiversity hunger maps.
Checklists
With the checklist approach one simply compares GBIF occurrence data with a list of species that should be in the country (or area). This is the gold standard of hunger mapping and should be the preferred method if a checklist exists.
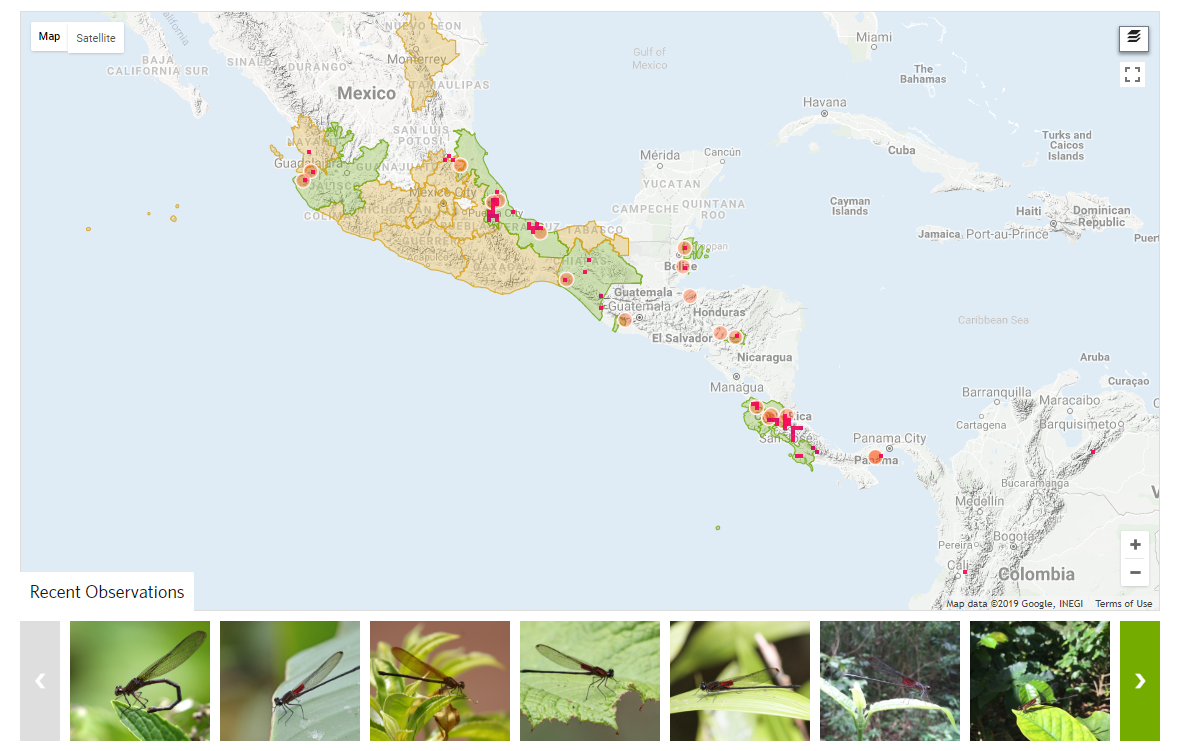
Here we see iNaturalists approach to hunger mapping. All checklists seen on iNauturalist are user supplied, meaning that a checklist is created for a region by using the same data that the observation is based on.
From iNaturalists' help page:
“Every place has a default check list, and whenever an observation is made within the place’s boundaries and it has achieved research-grade status, the species observed will get automatically added to the place’s check list.” – source
Obviously GBIF would not want to count occurrences as regional checklists as GBIF would be eating its own tail. Ideally we would want a set of regional checklists that have been created without the use of pre-existing GBIF occurrence datasets. This way we can tell what species should be in a certain country and compare with what species we have lat-lon occurrence data.
Here are some examples of some regional checklists published on GBIF:
- Korean Peninsula Flora
- Catalogue of Texas spiders
- Lista de táxones de la flora vascular española
- Checklist of Danish Fungi
- Checklist of Beetles of Canada and Alaska
- Checklist of Danish Flies and Mosquitoes
- Catalogue of the Lepidoptera of Belgium
Currently, regional checklist data is very patchy and disorganized. And if a country is very data-poor, it is even less likely to have a regional checklist.
Predictive modelling
While well-curated regional checklists are the gold standard of hunger mapping, they are very hard to organize and use. Another approach would be to generate species denisty maps through statistical modelling.
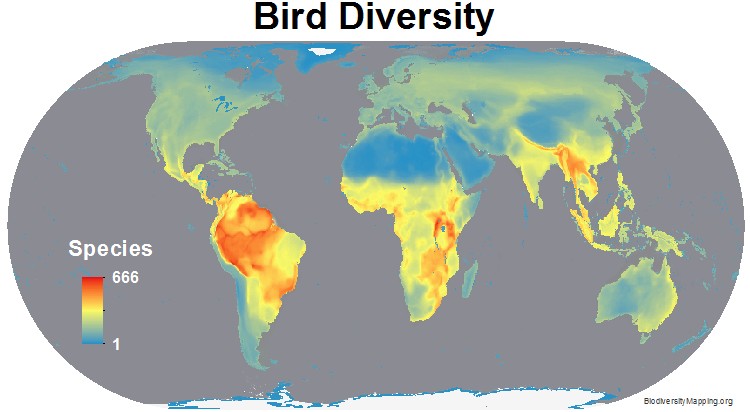
For example, this bird diversity map was produced by biodiversity mapping, using a statistical modeling approach citation. Such modelling approaches could be used to compare predicted versus observed species counts. Unfortunately generating global species richness maps requires fairly good global coverage.
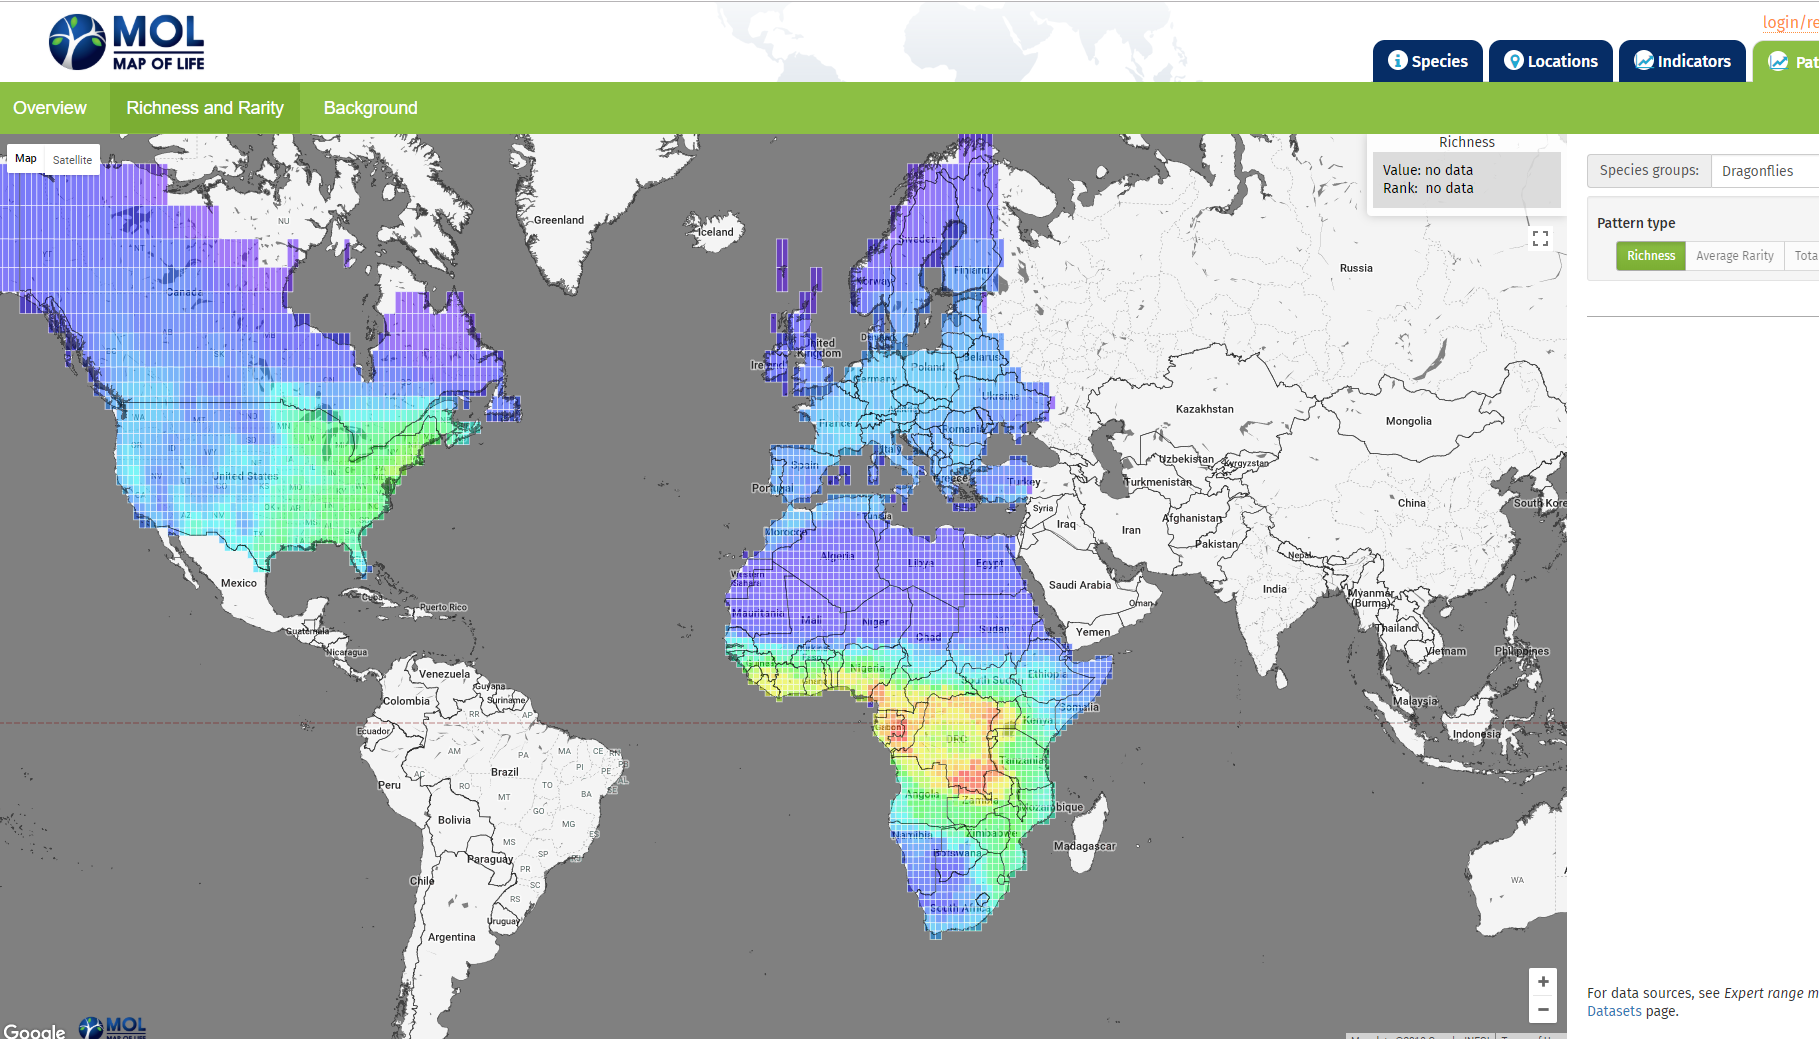
And even for groups like dragonflies, generating a global species richness map can be difficult, as we can see with this map of life species richness map for dragonflies.
Intuition and comparison
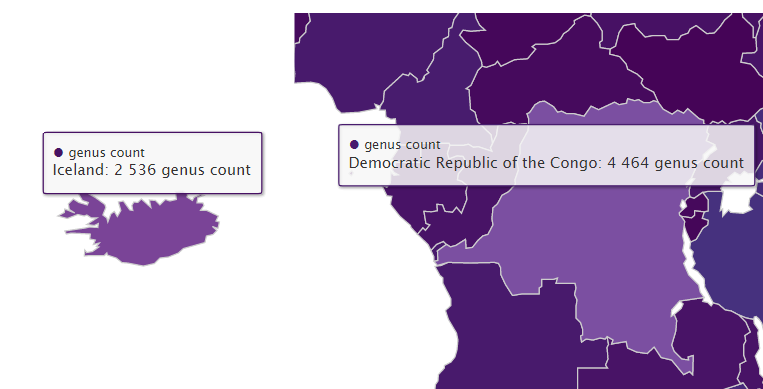
Below I plot the global genus counts of animals (kingdom Animalia) by country according GBIF occurrence data. On this map the United States has more animal genera than Brazil, and Iceland has similar animal genus counts to most African countries. Obviously one can infer there are likely large data-gaps present on this map without needing a checklist from each country.
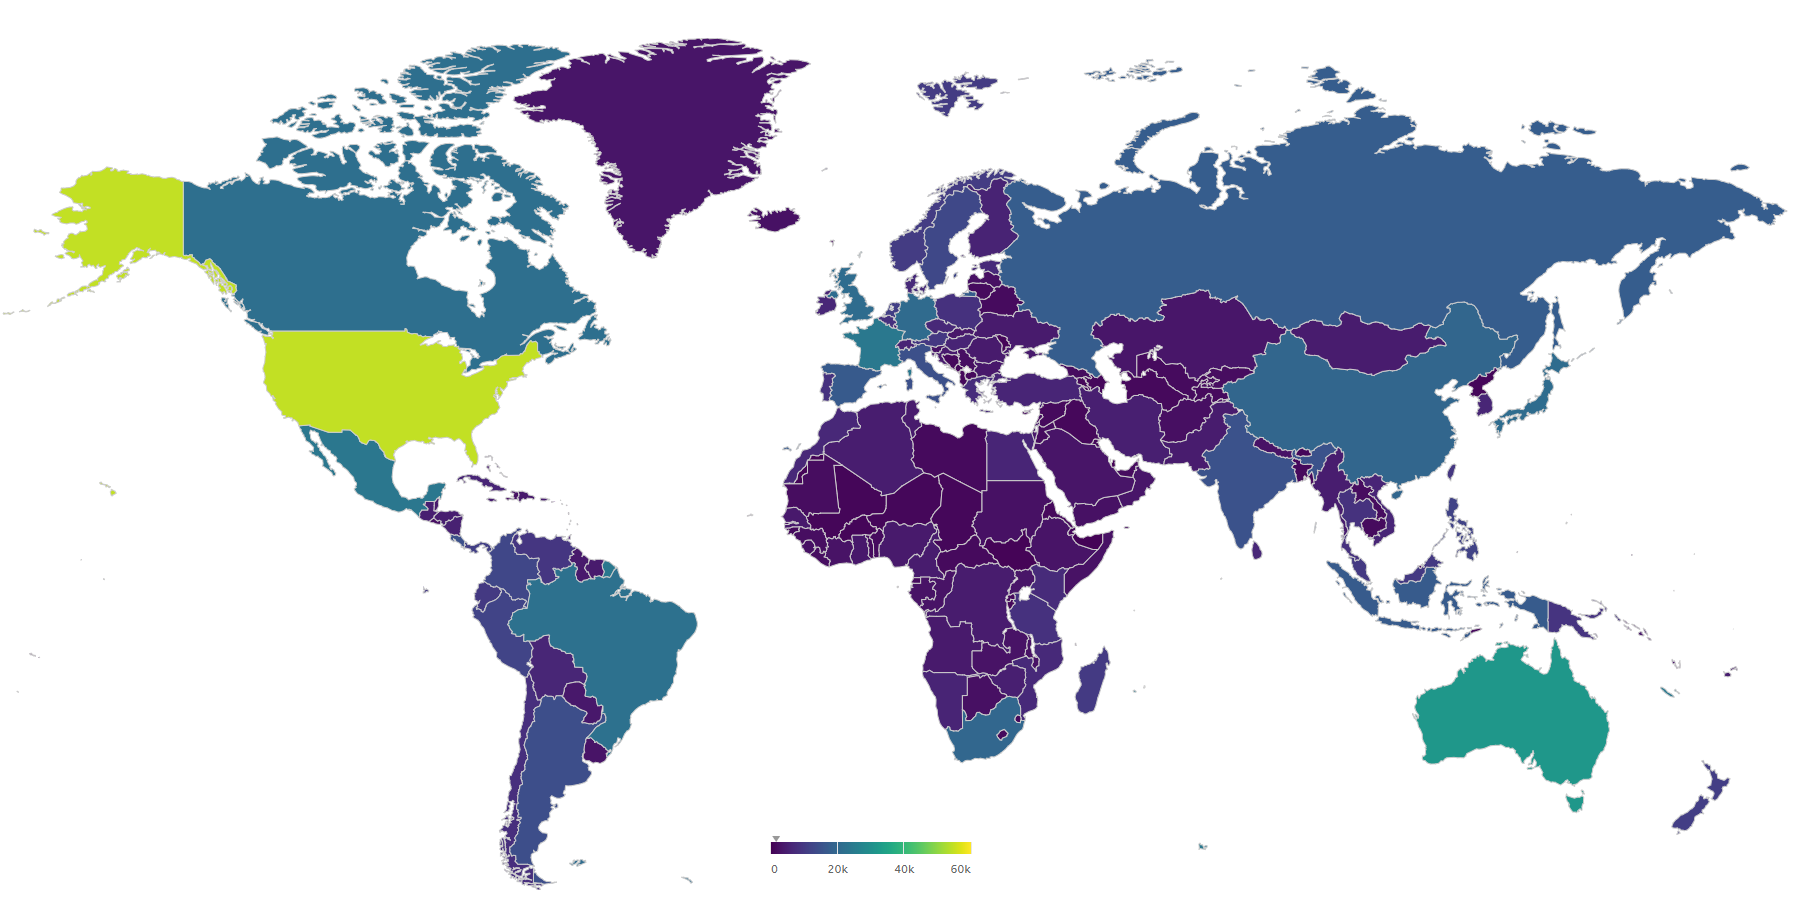
interactive map available here
Often an expert only needs taxon counts from a certain area to be able to judge if a data gap is present or not. Additionally even non-experts would be able to guess that DR Congo should have greater than two times the animal genus count of Iceland.
Interactive global genus count maps
Below I link to some interactive genus count maps. These maps should be used for illustration and comparison purposes only, since counting taxonomic units is a hard problem even at the genus level. The numbers might very much inflated by duplicates and synonyms (or other issues). In the maps above I have not run any quality controls like excluding extinct species and synonyms. Still the maps broadly highlight where the GBIF network might be hungry for data.
- Plants – kingdom Plantae genus count map
- Animals – kingodm Animalia genus count map
- Mammals – class Mammalia genus count map
- Amphibians – class Amphibia genus count map
- Ants – family Formicidae genus count map
- Birds – class Aves genus count map
- Butterflies – order Lepidoptera genus count map
- Dragonflies – order Odonata genus count map
- Frogs – order Anura genus count map
- Fungi – kingdom Fungi genus count map
- Conifer Trees – class Pinopsida genus count map
- Reptiles – class Reptilia genus count map
Problems with counting species
One issue that will effect any method is species counting. How to divide species will always be controversial. So even if we have a checklist or a model prediction of a species count this will need to be reconciled somehow with the GBIF backbone.
“We are currently working with Catalogue of Life and other partners to try to deliver a more seamless and complete working checklist of all species but, right now, our view of the available data includes hundreds of thousands of scientific names which may or may not be accepted species.”
– GBIF’s statement about species counts
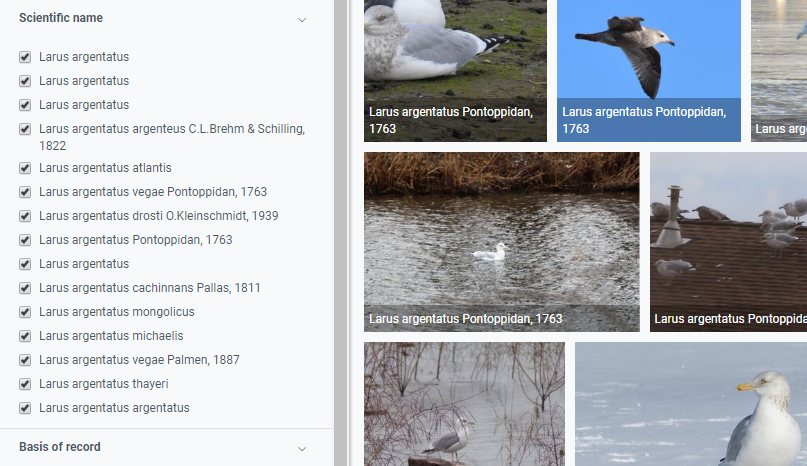
Even for common species like the European herring gull (Larus argentus) there are 15 unique names. Some of these names are subspecies names but some are simply duplicates. Cleaning up names for something less common than a seagull will be even more difficult.
Conclusions
Hunger mapping would be greatly aided by well-curated and clean dataset of regional checklists. Unfortunately, checklists datasets are currently very disorganized. Even if a checklist for a certain group exists in one region does not mean it will exist in another region. In the future GBIF occurrence datasets may act as default checklists.
Still with a little bit of domain knowledge and some common sense we can roughly map where we probably want to prioritize funding in the future. Looking at the animal genus counts of the countries in Asia and Africa, shows that the BIFA and BID projects are money well spent.