
Good SAMaritans - Introduction to best practices for publishing Survey and Monitoring (SAM) data to GBIF
Perhaps, like me, you don’t know much about publishing Survey and Monitoring data(“SAM data” ). Maybe you have heard about event cores and Humboldt extensions, and you aren’t quite sure how to fit data into these. Trust me, this is about to change!
I am on a mission to learn everything there is to know about publishing SAM data and spread the word. Don’t worry, I am under the guidance of our survey data mapping expert, Kate Ingenloff (who also happens to be in the office next door), so we are in good hands.
Before we get started, here is a little disclaimer: I am trying to make this series of post somewhat entertaining. If you are the type of person who doesn’t enjoy fluffy writing and goofy doodles, this post isn’t for you. Kate wrote an excellent comprehensive guide here (https://doi.org/10.35035/doc-ynvs-eh84). I highly recommend you read it as it is the basis for most of what is written here (but straight to the point).

For everyone else, let me introduce you to our new SAM data mascot: Sam the Secretary bird. Sam is here to illustrate some points in my post and to bring joy into the world. If you like having Sam here, let me know (I have a lot of fun creating drawings).
Today is a short introduction to survey and monitoring data and why they matter.
Mapping and sharing SAM data takes time and resources, so why it is it important? Is having events and Humboldt files much better than just occurrences?
Yes, and here is an example.
Many users come to GBIF to download data about a specific taxon with the goal of making a distribution map. Knowing where a species occurs is very helpful for work in research, conservation, policy making and finding good mushroom spots.
Imagine that you come to GBIF.org to map the distribution of a butterfly. (You may or may not decide to put that map on t-shirts for your butterfly-loving club, the FlyGuys).
You find three occurrences for this species in GBIF. How would you draw a map?

But you discover that these three occurrences are the result of Sam’s work, and Sam surveyed two more locations and didn’t find any butterflies there.
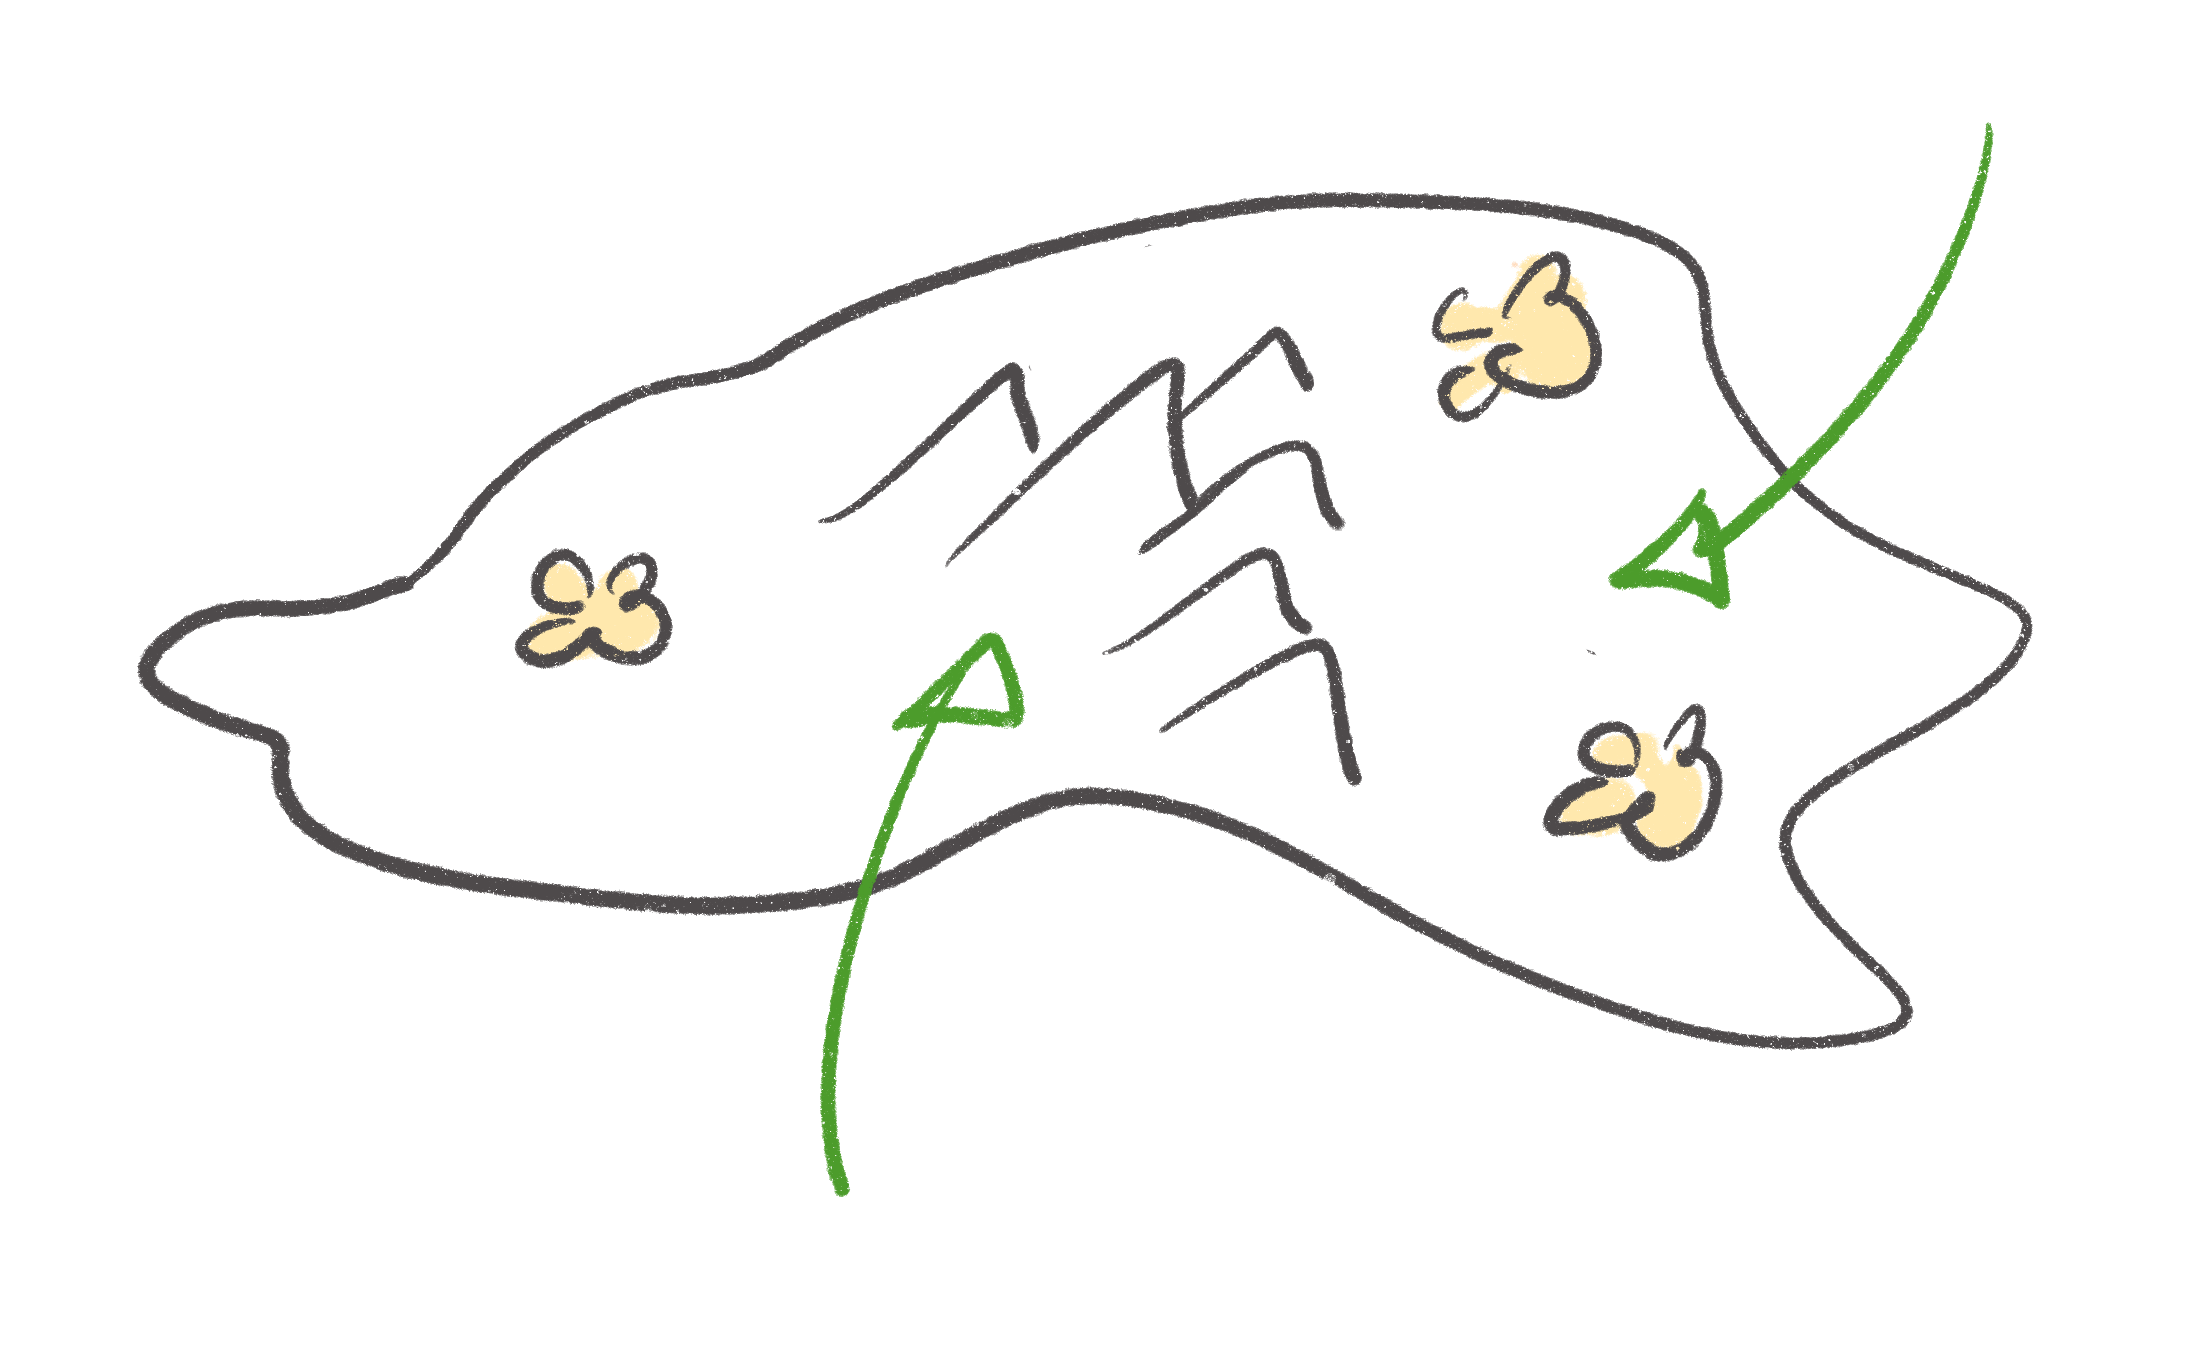
In fact, Sam was looking for imagos (a fancy word for adult or fully mature butterflies) belonging to that specific species (along with another species of butterfly) and didn’t find a specimen.

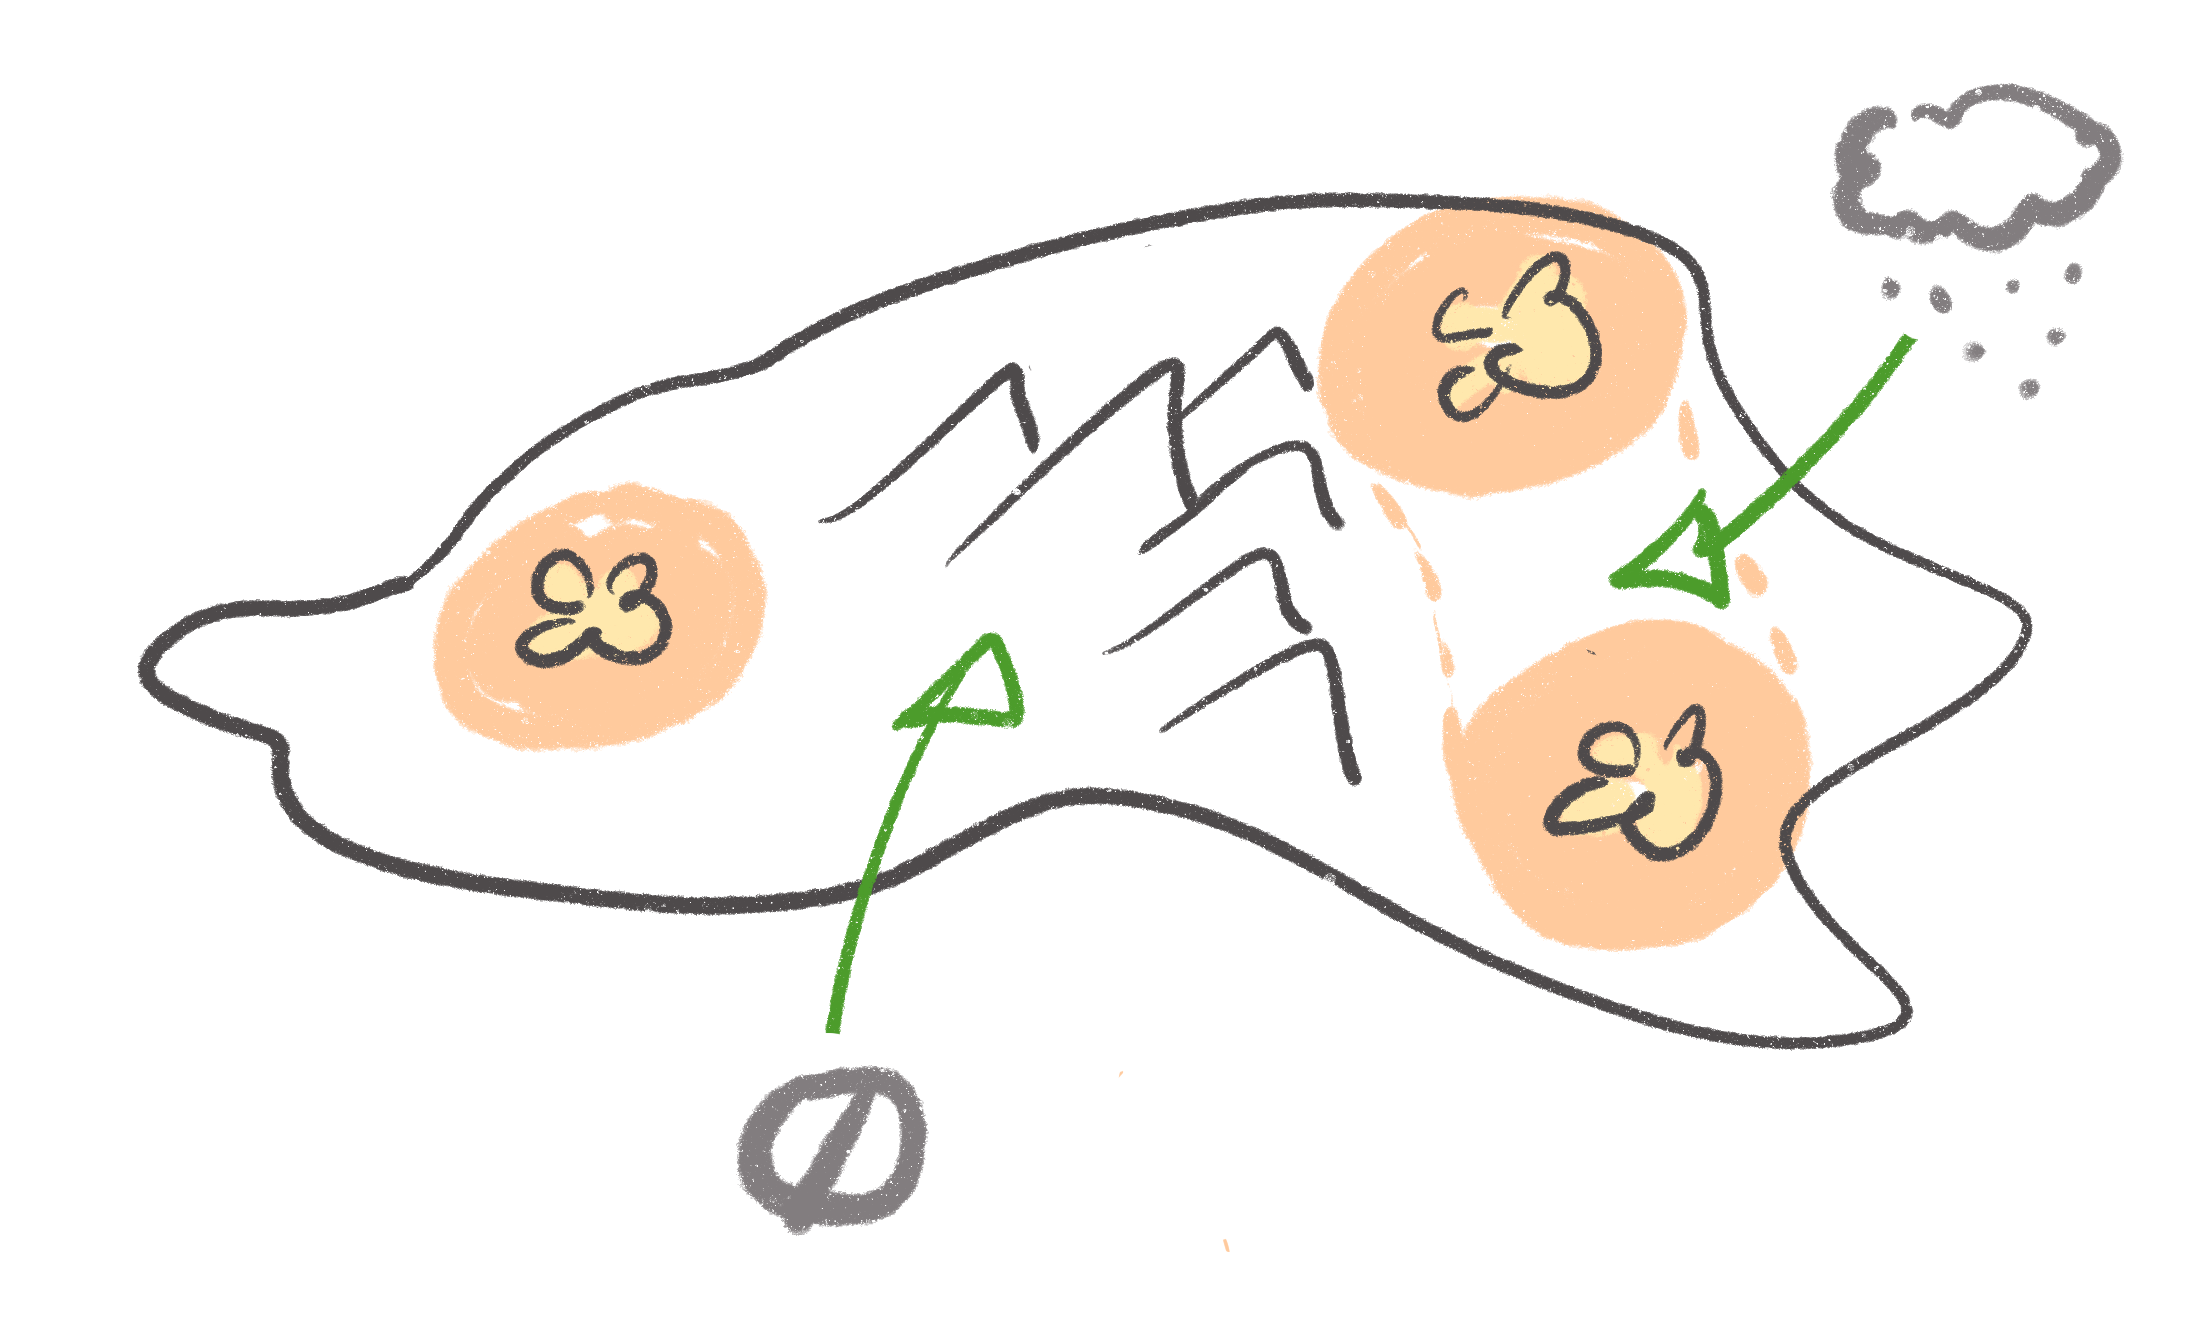
For one of the additional locations surveyed, Sam only had a small net and five minutes to survey 1,000 square meters (about 10,763 square feet). Perhaps it comes as no surprise that this terrible protocol resulted in no specimens being collected.
For the next location, Sam knew better and finally convinced their supervisors to get proper equipment. They were able to use a machine to catch all butterflies and had two eight hour days to survey the same area three times.
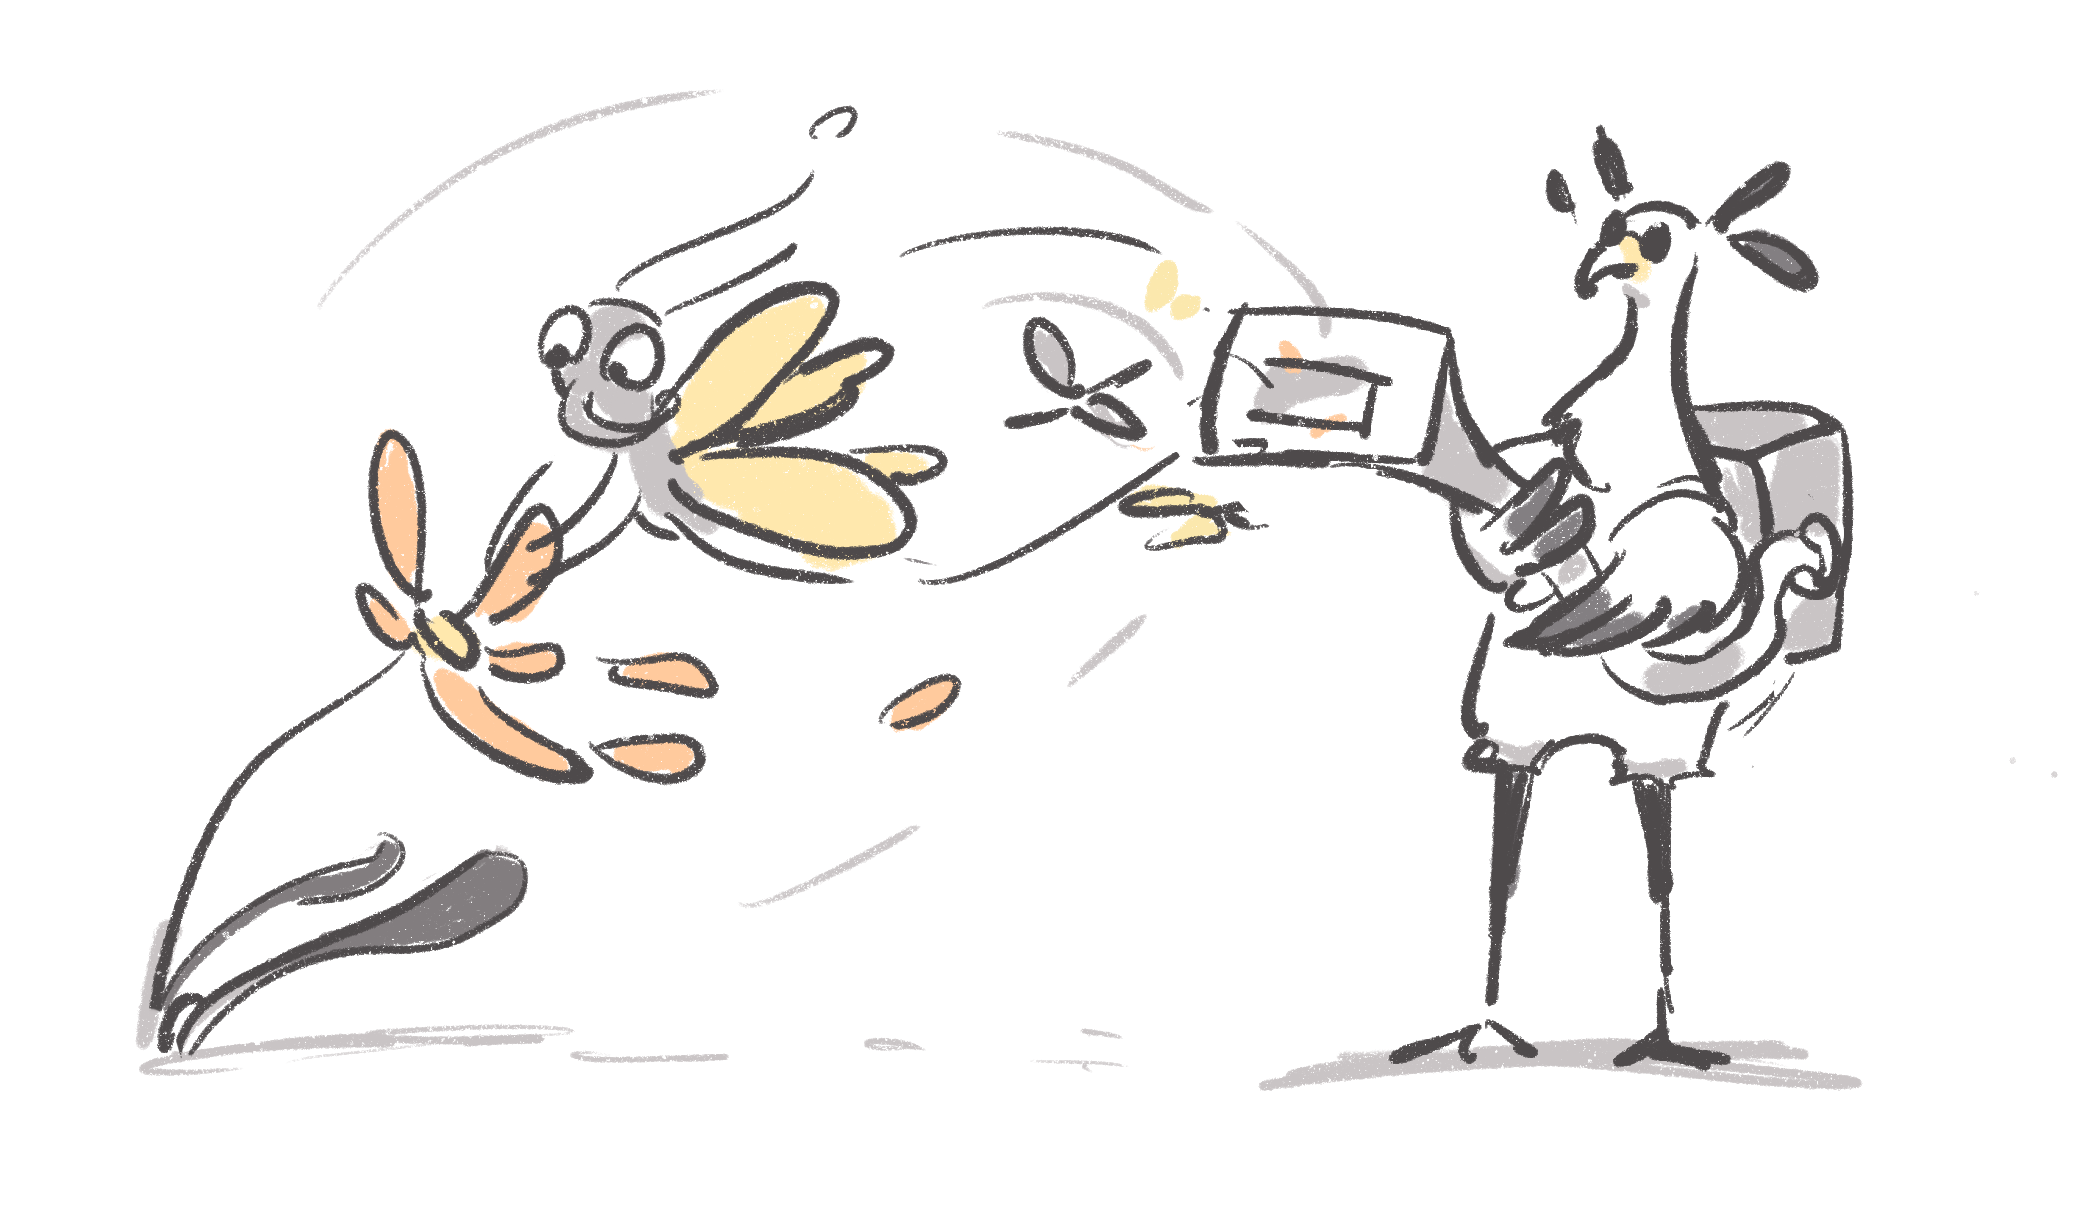
Happy with this new, updated protocol, Sam came back to the previous location to re-survey the areas. Unfortunately, the weather wasn’t on Sam’s side and once again, no butterflies were found.

If you only had access to the occurrences, you wouldn’t be able to differentiate between absences and lack of sampling. The documented protocol and efforts also give you more context for quantitative analysis and comparison across studies.
At last, thanks to all that additional SAM data, you can make a refined map and no-one (not even the vice chair of the FlyGuys) will be able to deny your contribution to the club.
The good news is that any bit of data provided is already helping a lot! Data publishers don’t need to map everything all at once.
If you are a data provider, you can start by making a list of what type of information you already have based on the information we would consider including with a SAM dataset. What type of information, you ask? We can adapt the 5 W’s of journalism to for mapping SAM data. The questions become:
Who did what, when, where, how, and to what extent (how much)?
I made an example using Sam’s work. You can too; I even made a little printable PDF to get you started.
In the next posts, we will focus on specific aspects of mapping SAM data. Now that the Darwin Core Data Package (DwC-DP) is ratified and optimized to support complex SAM data, we will cover both Darwin Core data models: DwC-A Event core with Humboldt extension and the DwC-DP.
By the end of this series, I (and by extension, you) should be fluent in both the DwC Archives Event core and the DwC Data Package for SAM data.
Until then, I will leave you with Sam’s cheat sheet so you can get started!
